
Your reports disagree. I find out why.
When three systems give three different answers to the same question, someone ends up rebuilding the numbers by hand the night before the board meeting.
I trace your figures back through every database, query, spreadsheet and manual step to show you exactly where they diverge, which source should be trusted, and what to fix first.
You get findings in plain business language, not a transformation proposal
Dr Ian Kirby. SQL Server, PostgreSQL and reporting logic across financial services, education and research.
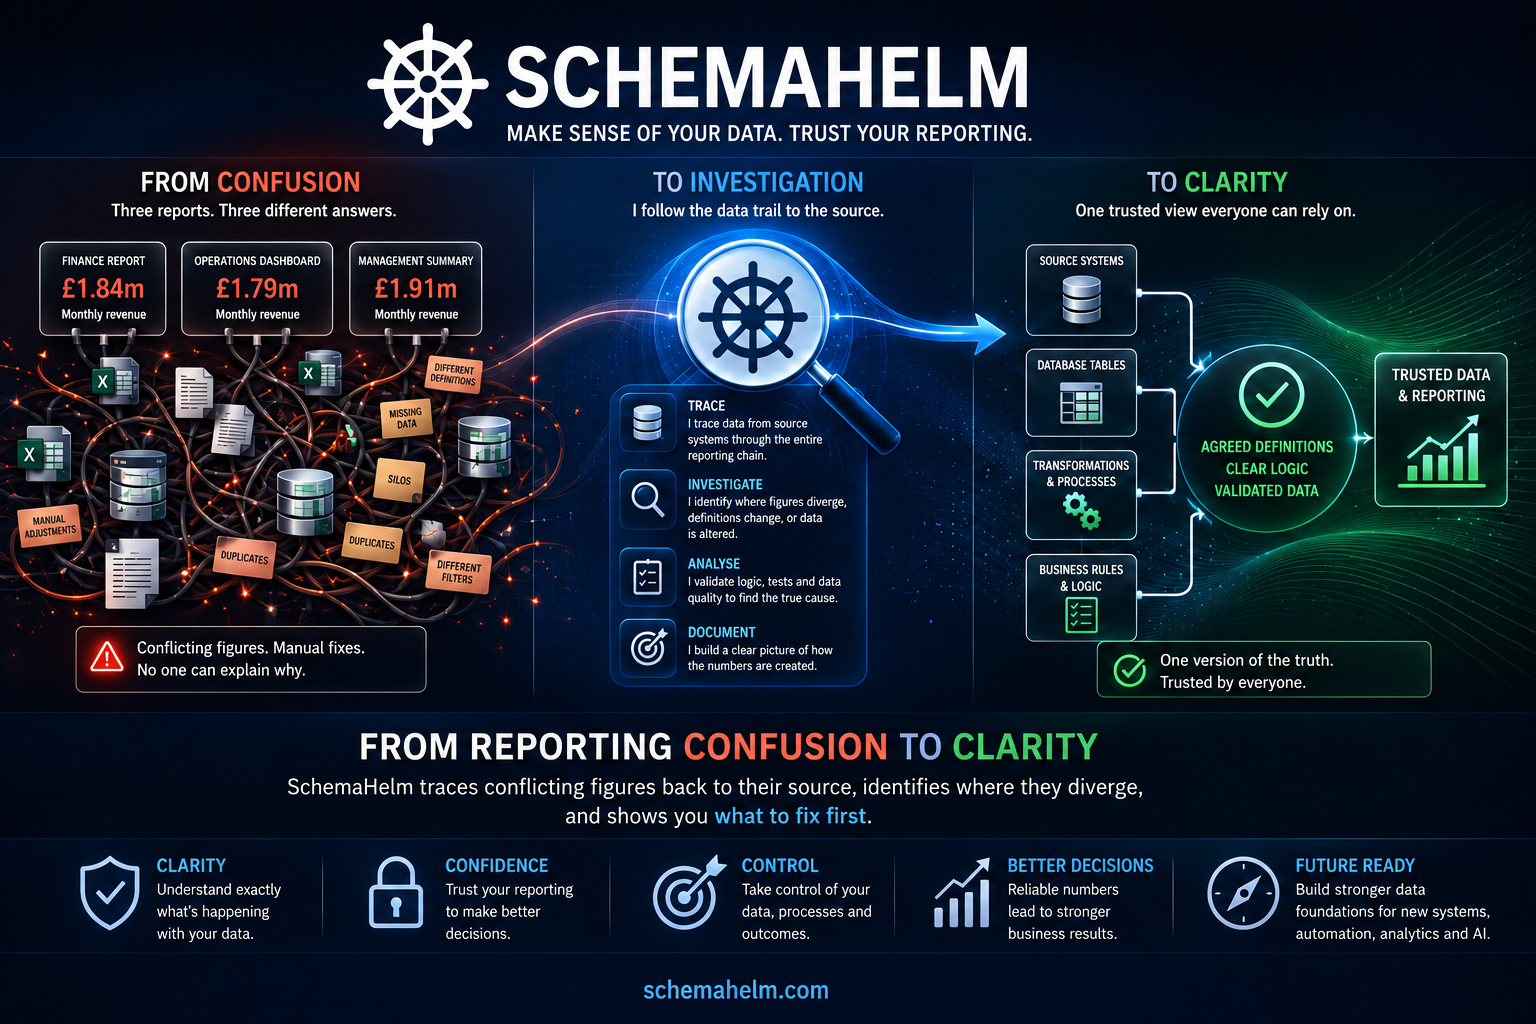
Helping businesses fix unreliable reporting today and build stronger data foundations for smarter automation and trusted AI tomorrow.
WHERE REPORTING STARTS TO BREAK DOWN
Your reports should help you make decisions, not create more questions. As businesses grow, their data and reporting processes often become harder to follow. Systems are added, spreadsheets multiply, definitions change and temporary workarounds quietly become permanent business processes.
Eventually, different reports begin showing different answers and nobody can clearly explain why.
Sound familiar?
Finance and operations report different figures for the same month.
Different teams may be using different definitions, filters, calculations or versions of the same data. Nobody can say with confidence which number is right, so the meeting stalls while someone goes away to check.
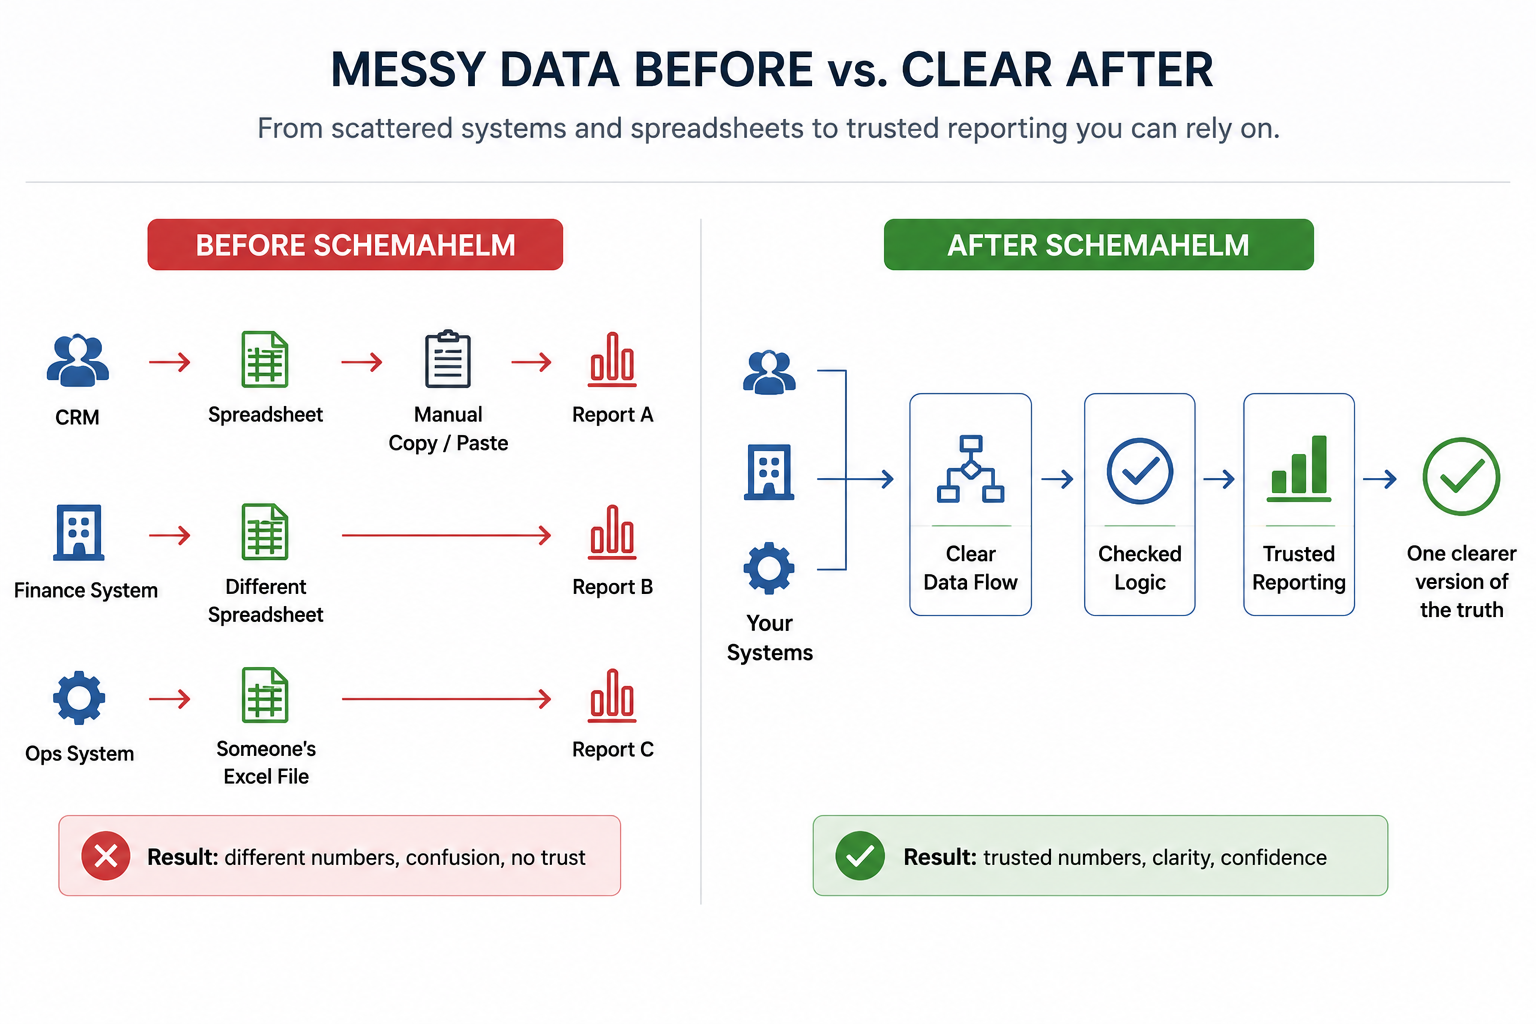
Disconnected systems and one critical spreadsheet.
Important information is often spread across databases, spreadsheets, reporting tools and business systems without a clearly understood reporting path. Sometimes one spreadsheet ends up holding the process together and one person understands how it works. When they are unavailable, the whole reporting cycle becomes fragile.
Every month end involves manual reconciliation nobody has time for.
Hand-built spreadsheets, corrections and repeated manual steps can mask deeper problems in the underlying process. A workaround introduced temporarily can quietly become a permanent business process.
You are planning a new system, automation or AI initiative, but you do not fully trust the data underneath.
When data sources, definitions, ownership or reporting logic are unclear, new technology can inherit the same problems. Understanding what can be trusted, who is accountable and what needs attention first can help create a stronger foundation for system replacement, integration, automation and AI.
HOW IT WORKS
Three steps, no guesswork
1. You describe what is not adding up
You do not need to diagnose the problem first.
“Our two revenue reports disagree and I don’t know why” is enough to start.
2. I follow the trail
I work backwards from the disputed figure through databases, queries, extracts, spreadsheets, reporting tools and manual steps.
I look at:
where the data originates
how it moves between systems
where values are transformed or corrected
which definitions, filters and calculations are being applied
why reports or dashboards show different answers
where manual intervention creates risk
which data source should be treated as authoritative
3. You get findings you can act on
You receive a clear written explanation of what is happening, where the figures diverge, which source should be trusted, what the risks are and what should be fixed first.
The findings are written in plain business language, so they can be understood by decision-makers as well as technical teams.
In plain English
I follow the trail behind your business numbers.
I identify where information comes from, what happens to it along the way and why the final reports may not match.
The aim is simple: clearer data flow, checked logic and reporting your business can trust.
EXAMPLE DIAGNOSTICS
Three reports. Three different answers.
A fictional example showing how I trace conflicting figures back through the reporting chain, identify where they diverge, and turn the findings into a practical plan.
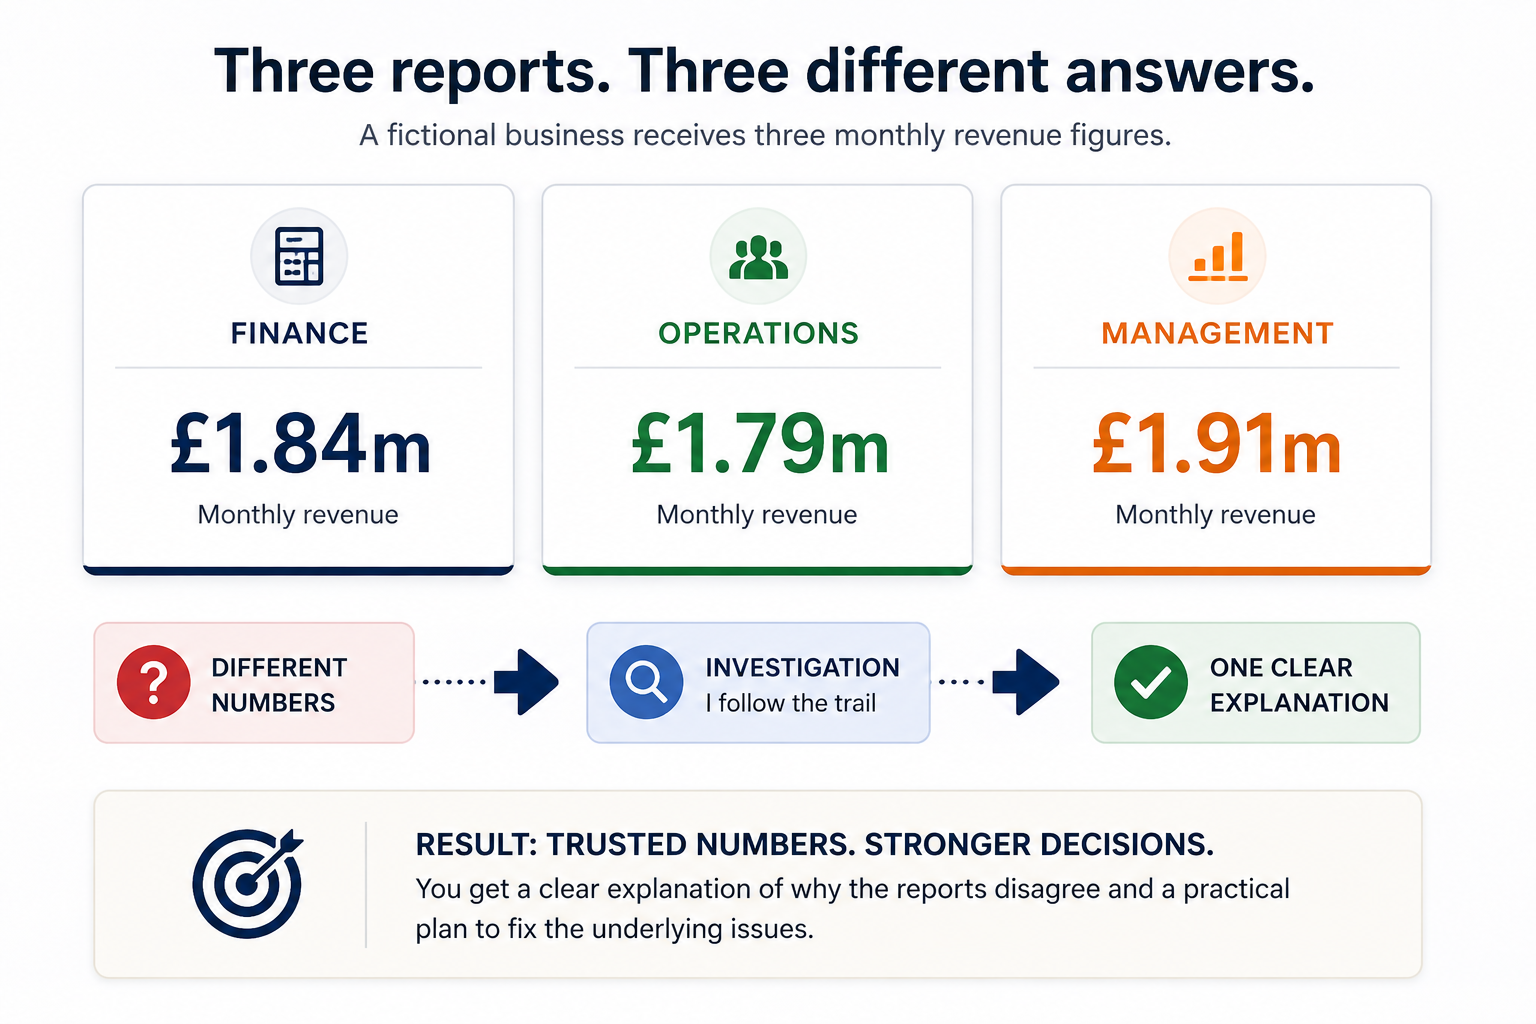
This example is fictional and is included to demonstrate the type of reporting problem SchemaHelm can investigate.
WHO I AM
Dr Ian Kirby
Founder of SchemaHelm
I have spent years working with SQL, reporting logic, systems analysis and data validation across financial services, education and research.
Much of that work has involved answering a version of the same question:
Why is this number not what it should be?
I founded SchemaHelm to help businesses develop a clearer, more trustworthy understanding of the data beneath their reporting. What they often lack is a clear, trustworthy understanding of the data beneath their reporting.
When that foundation is unclear, decisions become slower, reporting becomes harder to trust and future automation can amplify existing problems rather than solve them.
SchemaHelm is my way of helping businesses investigate those problems, understand what is really happening and build stronger reporting foundations.

WHO SCHEMAHELM IS FOR
Built for organisations that need greater confidence in their data, reporting and the foundations supporting what comes next
SchemaHelm may be a good fit when your organisation is dealing with:
reports or dashboards showing conflicting figures
data spread across several systems or spreadsheets
unclear source-of-truth logic
fragile SQL or reporting processes
business-critical spreadsheet workarounds
undocumented calculations or transformations
reporting knowledge concentrated in one or two people
repeated manual reconciliation
plans for new systems, automation or AI built on uncertain data foundations
SchemaHelm is particularly suited to organisations that need clarity before committing to a larger system replacement, reporting project or transformation programme.
How SchemaHelm helps
SchemaHelm provides practical support for businesses dealing with messy reporting, unclear schema, disconnected systems, and fragile reporting logic.
Find out where the reporting confusion, duplication and risk are actually coming from.
See how data moves between your systems, tables, reports and manual processes, and where it breaks.
Reporting Reconciliation & Logic Review
Find out why two reports disagree, and which one you should believe.
Data Readiness for New Systems, Automation & AI
Find out whether your existing data, definitions, ownership and reporting foundations are ready to support the new system, automation or AI initiative you are planning.
QUESTIONS I GET ASKED
How long does this take?
A focused diagnostic may take several days, while larger mapping or reconciliation work depends on the number of systems, reports and processes involved. I will agree the scope and expected timescale before any work starts.
Will you try to sell me a new platform?
No. I do not resell software. If the problem is a definition, reporting rule, spreadsheet workaround or piece of logic, I will say so rather than recommending technology for the sake of it.
What access do you need?
That depends on the problem. I normally aim to work with the minimum access needed, using read-only access where appropriate, together with relevant reports, extracts or spreadsheets. Any data-access and security requirements will be agreed before work begins.
What if the problem is bigger than expected?
I will document what I find, explain the scale of the issue and set out the priorities before recommending any additional work.
What if specialist engineering is required?
I will say so clearly. I diagnose, reconcile and map reporting problems. Where specialist platform engineering, security or implementation expertise is required, I will help define the next step rather than stretching beyond my scope.
START BY DESCRIBING WHAT IS NOT ADDING UP
You do not need to know where the problem sits before getting in touch.
If your reports disagree, your spreadsheets have become business-critical workarounds, or you are being asked to automate on foundations you are not confident in, tell me what you are seeing.
I will let you know whether SchemaHelm is the right fit and where I would suggest starting.
HAVE A REPORTING PROBLEM YOU'D RATHER TALK THROUGH?
Call me for an initial conversation and tell me what's happening.
CALL: 07391 588479
Email: info@schemahelm.com
I aim to respond within 1 business day.